


Overview of the Customer Health Data dashboard
The involve.ai platform gathers all customer data sources your organization provides and synthesizes it into a single number: the involve.ai Customer Health Renewal Index.
Why is a unified view of customer health important?
When different types of customer data are data locked away in various systems and spreadsheets, understanding how each lever of health impacts churn is nearly impossible and maintaining health is tedious and biased.
Our AI does this work for you in real time so that you can see the full picture of your customers’ health and identify patterns, without bias.
How the AI works
involve.ai’s machine learning models analyze your organization’s unique sets of data and compare every single metric to like customers in seconds. Then, they gather each metric under one of six broad Key Performance Indicators (for example, Product Usage, or Sentiment) and roll those KPIs into an overall health for each customer. The more data involve.ai has access to, and the more time users spend interacting with the dashboard, the more accurate the health outcomes become.
How to use the customer health dashboard to its fullest
Every morning, if you have time to do only one thing, check your customers’ health! Based on the breakdown of your renewal index categories, you will be able to assess your high priority customers and take actions to maintain strong relationships or ameliorate risky ones.
Daily GROW model for using involve.ai
Dashboard details
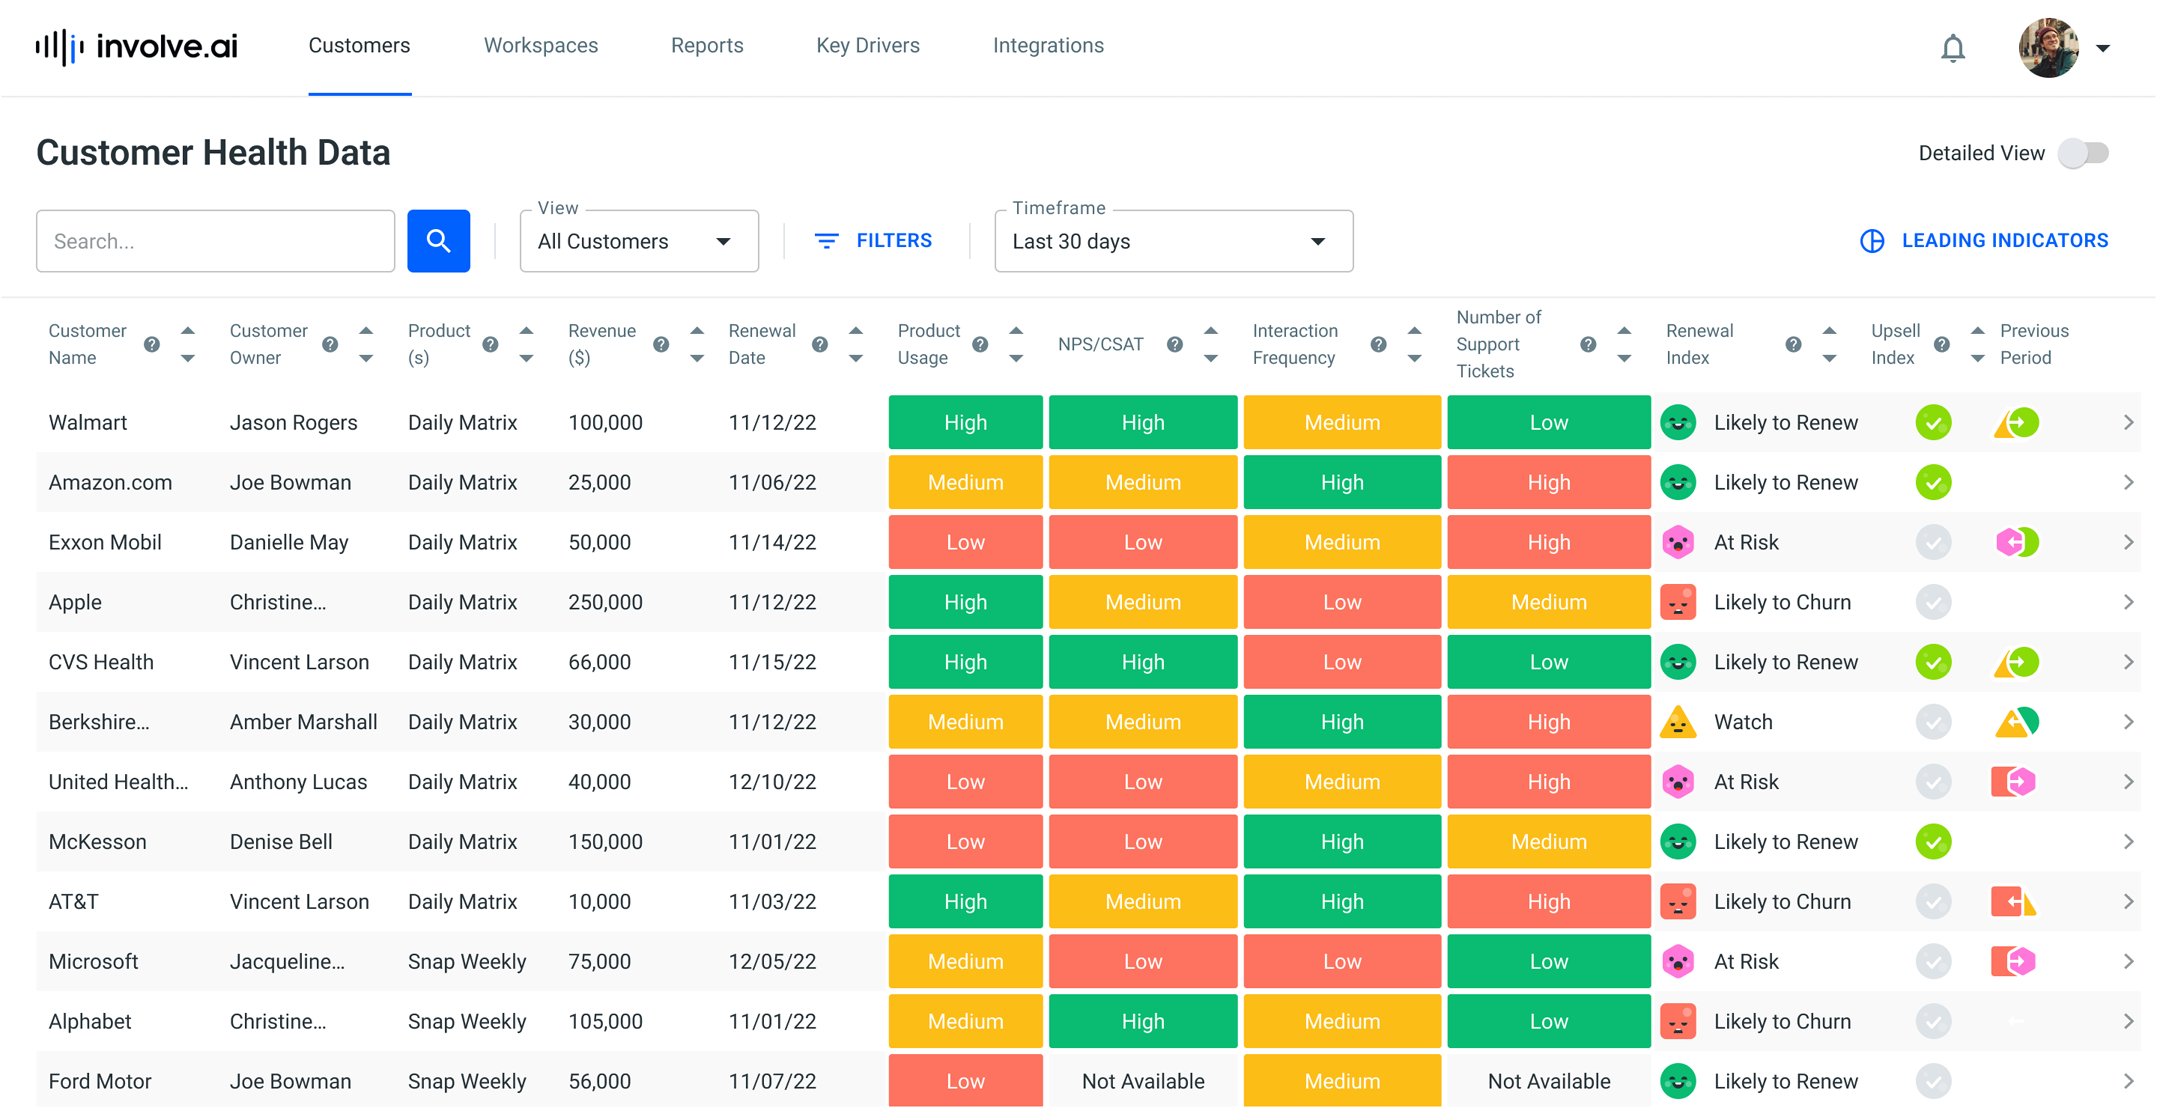
Default view
The dashboard offers a snapshot view of all of your organization’s customers, including static, demographic data, indicated in gray, and colorful, dynamic KPI columns, which are categories into which all other metrics roll into.
Users can toggle on the Detailed View switch in the upper right corner of the screen to see those individual metrics rolling into the KPIs instead of the Low, Medium and High values shown by the default view.
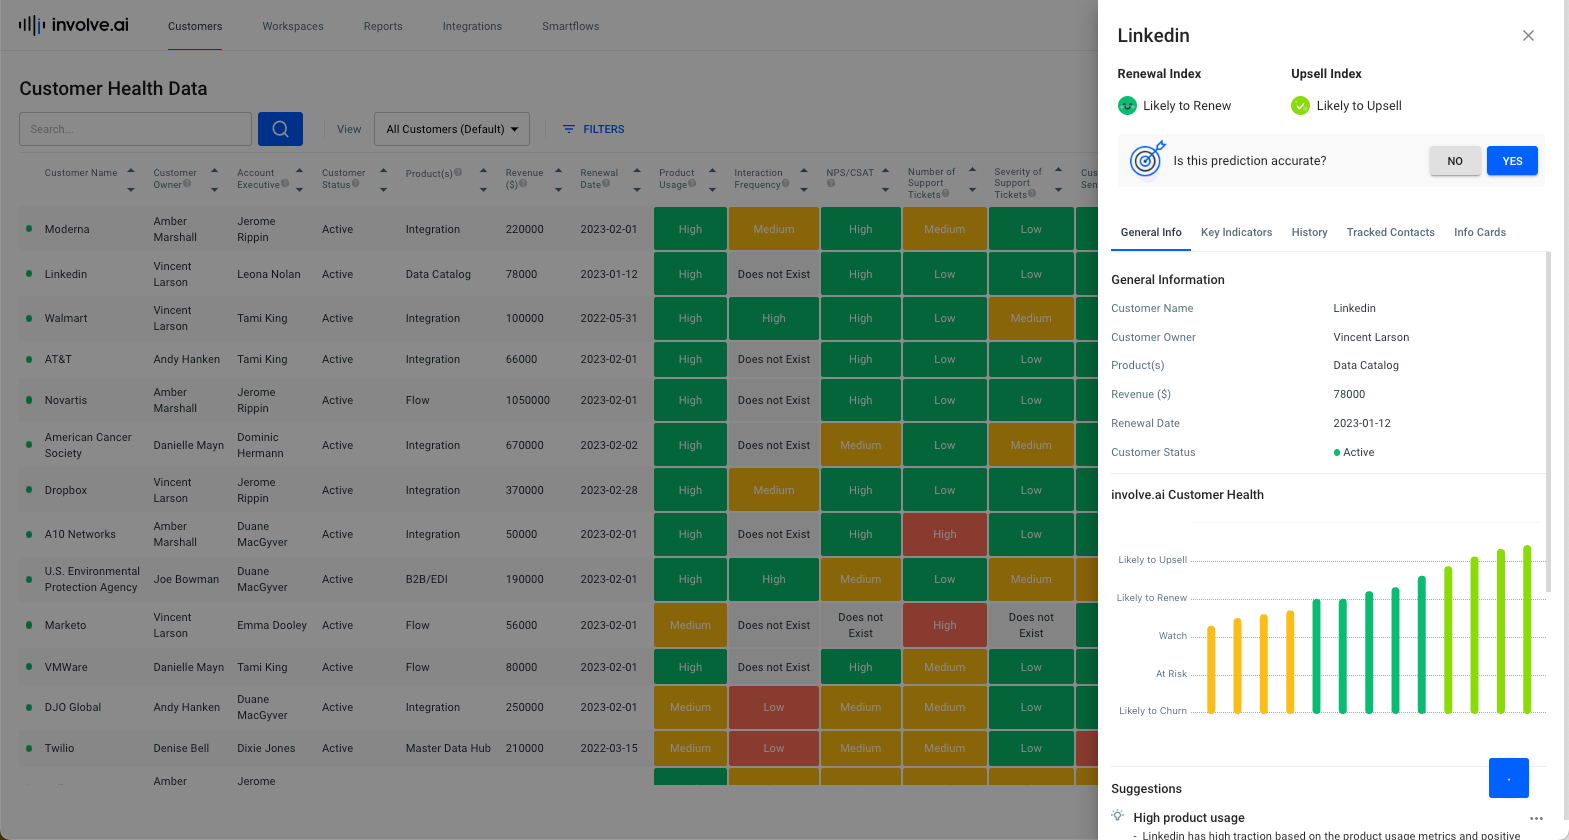
Slide-out additional details
In addition to the information listed above, users can view customer-specific account history by clicking the > icon at the end of each row to pull open a side menu for each customer. These side menus contain in-depth qualitative and quantitative information. Users can provide feedback about the accuracy of involve.ai's health and recommendations (which in turn improves future accuracy), view historic data including reasons for sentiment, convert insights into info cards, and add ad hoc tasks and notes directly.
Sort and filter features
Select filter to find the following options:
- Keyword Search: Use the search text box to search by
- Customer Name
- Customer Owner
- "High / Medium / Low" category values
- Revenue
- Renewal Date
- Involve AI Customer Health Percentage
- Customer Status
- Customer Name
- Customer Owner
- Product(s)
- Revenue
- Renewal Date
- Various columns in the dashboard, including but limited to:
- Upsell
- Product Usage
- NPS/CSAT
- Interaction Frequency
- Number of Support Tickets
- Severity of Support Tickets
- Customer Sentiment
- Customer Owner Pulse
- Involve.ai Customer Health
Each category on the dashboard is sortable from highest to lowest or vice versa by clicking on the arrows next to each category header.
NOTE: customizations are not included in this list.